isotopylog.kDistribution.plot
-
kDistribution.plot(ax=None, lnd={}, invd={})¶ Generates a plot of ln(k) distributions for ‘HH21’-type models.
Parameters: - ax (None or plt.axis) – Axis for plotting results; defaults to None.
- lnd (dict) – Dictionary of stylistic keyword arguments to pass to plt.plot() when plotting lognormal results. Defaults to empty dict.
- invd (dict) – Dictionary of stylistic keyword arguments to pass to plt.plot() when plotting inversion results, if they exist. Defaults to empty dict.
Returns: ax – Updated axis containing results.
Return type: plt.axis
Raises: ValueError– If the kDistribution instance is of a model type that does not support plotting. Currently, only ‘HH21’ supports plotting.See also
isotopylog.EDistribution.plot()- Class method for plotting EDistribution data as Arrhenius plots.
Examples
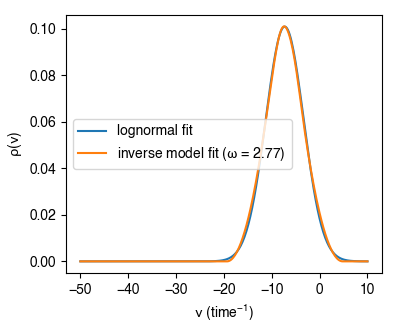
Basic implementation, assuming ipl.kDistribution instance kd exists and is of ‘HH21’ model type:
#import modules
import isotopylog as ipl
import matplotlib.pyplot as plt

#make figure
fig, ax = plt.subplots(1,1)

#plot results
kd.plot(ax = ax)
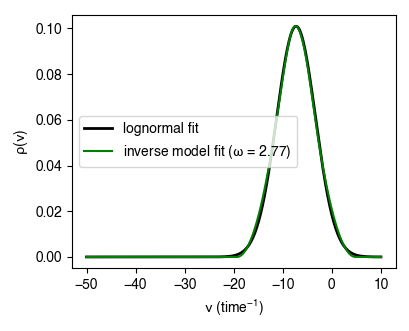
Similar implementation, but now putting in stylistic keyword args:
#import modules
import isotopylog as ipl
import matplotlib.pyplot as plt

#make figure
fig, ax = plt.subplots(1,1)

#define plotting style
lnd = {'linewidth':2, 'c':'k'}
invd = {'linewidth':1.5, 'c':'g'}

#plot results
kd.plot(ax = ax, lnd = lnd, invd = invd)