isotopylog.HeatingExperiment.plot
-
HeatingExperiment.plot(ax=None, yaxis='D', logy=False, plot_reg=False, ed={'fmt': 'o'}, ld={}, fbd={'alpha': 0.5}, regd={})¶ Plots experimental and forward-modeled results in various user-defined ways.
Parameters: - ax (plt.axis or None) – Matplotlib axis instance to plot data on. If
None, creates an axis. Defaults toNone. - yaxis (string) – The variable to plot on the y axis, either
'D'or'G'. Defaults to'D'. - logy (boolean) – Tells the funciton whether or not to log transform the y axis.
Defaults to
False. - plot_reg (boolean) – Tells the function whether or not to plot regularized inversion
forward-model results as well. Only applies if
model = 'HH21'andfit_reg = True. - ed (dictionary) – Dictionary of keyward arguments to pass for plotting the
experimental data. Must contain keywords compatible with
matplotlib.pyplot.errorbar. Defaults to dictionary with ‘fmt’ = ‘o’. - ld (dictionary) – Dictionary of keyward arguments to pass for plotting the mean of
the forward-modeled data. Must contain keywords compatible with
matplotlib.pyplot.plot. Defaults to empty dictionary. - fbd (dictionary) –
Dictionary of keyward arguments to pass for plotting the forward- modeled uncertaint range. Must contain keywords compatible with
matplotlib.pyplot.errorbar. Defaults to dictionary with ‘alpha’= 0.5.. - regd (dictionary) – Dictionary of keyword arguments to pass for plotting the regularized
forward-model data. Must contain keywords compatible with
matplotlib.pyplot.plot. Defaults to empty dictionary.
Returns: ax – Updated axis instance containing the plot.
Return type: plt.axis
Warning
- UserWarning
- If the user is passing
plot_reg = Truebut the heating experiment does not contain regularized inverse model forward results; that is, if it was fit with something other than'HH21'model withfit_reg = True.
See also
isotopylog.kDistribution.plot()- Plotting function for the
kDistributionclass. isotopylog.EDistribution.plot()- Plotting function for the
EDistributionclass.
Examples
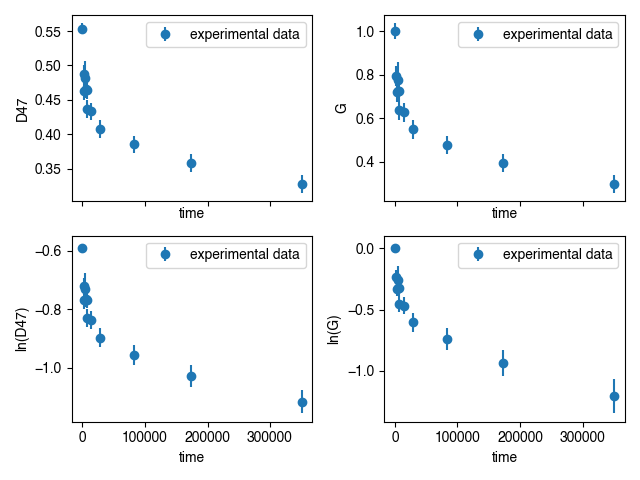
Plotting experimental and forward-modeled results:
#make an axis
fig, ax = plt.subplots(2,2,sharex = True)

#first, plot D
ax[0,0] = he.plot(ax = ax[0,0], yaxis = 'D', logy = False)

#second, plot G
ax[0,1] = he.plot(ax = ax[0,1], yaxis = 'G', logy = False)

#third, plot log(D)
ax[1,0] = he.plot(ax = ax[1,0], yaxis = 'D', logy = True)

#finally, plot log(G)
ax[1,1] = he.plot(ax = ax[1,1], yaxis = 'G', logy = True)
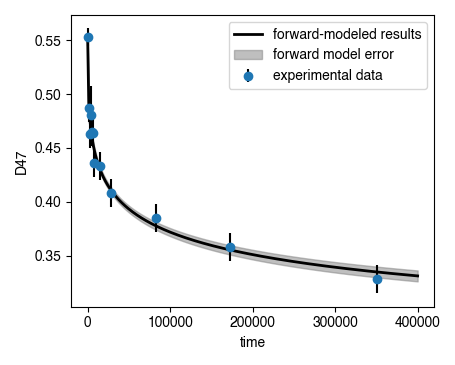
When making plots, one can pass various dictionaries containing stylistic keyword arguments:
fig, ax = plt.subplots(1,1)

#experimental data plt.errorbar dict
ed = {fmt = 'o', ecolor = 'k'}

#forward-modeled mean plt.plot dict
ld = {linewidth = 2, c = 'k'}

#forward-modeled uncertainty plt.fill_between dict
fbd = {alpha = 0.5, color = [0.5, 0.5, 0.5]}

#plot the data
ax = he.plot(ax = ax, ed = ed, ld = ld, fbd = fbd)
- ax (plt.axis or None) – Matplotlib axis instance to plot data on. If