isotopylog.HeatingExperiment
-
class
isotopylog.HeatingExperiment(dex, T, tex, **kwargs)¶ Class for inputting, storing, and visualizing clumped isotope heating experiment data. Currently only accepts D47 clumps, but will be expanded in the future as new clumped system data becomes available.
Parameters: - dex (array-like) – Array of experimental isotope values, written for each time point as
[D, d1, d2] where D is the clumped isotope measurement (e.g., D47) and
d1 and d2 are the corresponding major isotope values, listed from
lowest to highest amu (e.g., d13C, d18O). Length
ntex. - T (int, float, or array-like) – The equilibrium temperature at which the experiment was performed, in
Kelvin. If array-like, must be length
ntex. - tex (array-like) – Array of experimental time points, in units of time. While the exact
time unit is flexible, all subsequent calculations will depend on
time unit chosen (e.g., if minutes, then rates are inverse minutes).
Length
ntex. - calibration (string or LambdaType) –
The D-T calibration curve to use, either from the literature or as a user-inputted lambda function. If from the literature for D47 clumps, options are:
'PH12': for Passey and Henkes (2012) Eq. 4 (CDES 25C)'SE15': for Stolper and Eiler (2015) Fig. 3 (Ghosh 25C)'Bea17': for Bonifacie et al. (2017) Eq. 2 (CDES 90C)'Aea21': for Anderson et al. (2021) Eq. 1 (I-CDES)If as a lambda function, must have T in Kelvin. It is recommended to run each calibration only using its native reference frame (denoted in parentheses); although these will be automatically adjusted to different reference frames, there is no guarantee that this conversion is accurate for all analytical setups. In contrast, lambda functions must be reference-frame specific. Defaults to
'Aea21'. - clumps (string) – The clumped isotope system under consideration. Currently only
accepts ‘CO47’ for D47 clumped isotopes, but will include other
isotope systems as they become more widely used and data become
available. Defaults to
'CO47'. - D (None or array-like) – Array of forward-modeled clumped isotope values (e.g., D47). Length
nt; defaults toNone. - D_std (None or array-like) – Propagated standard deviation of forward-modeled D values. Length
nt; defaults toNone. - dex_std (None or array-like) – Analytical standard deviation of experimentally measured d values.
Shape [
ntx 3]. Defaults toNone. - iso_params (string) –
The isotope parameters used to calculate clumped data. For example, if
clumps = 'CO47', then isotope parameters are R13_vpdb, R17_vpdb, R18_vpdb, and lam17. Following Daëron et al. (2016) nomenclature, options are:'Barkan': for Barkan and Luz (2005) lam17'Brand'(equivalent to'Chang+Assonov'): for Brand (2010)'Chang+Li': for Chang and Li (1990) + Li et al. (1988)'Craig+Assonov': for Craig (1957) + Assonov and Brenninkmeijer (2003)'Craig+Li': for Craig (1957) + Li et al. (1988)'Gonfiantini': for Gonfiantini et al. (1995)'Passey': for Passey et al. (2014) lam17Defaults to
'Brand'. - ref_frame (string) –
The reference frame used to calculate clumped isotope data. Options are:
'CDES25': Carbion Dioxide Equilibrium Scale acidified at 25 C.'CDES90': Carbon Dioxide Equilibrium Scale acidified at 90 C.'Ghosh': Heated Gas Line Reference Frame of Ghosh et al. (2006) acidified at 25 C.'I-CDES': Carbon Dioxide Equilibrium Scale acidified at 90 C, referenced to carbonate standards as described in Bernasconi et al. (2021).Defaults to
'I-CDES'. - t (None or array-like) – Array of forward-modeled time points, in the same time units as
tex. Defaults toNone. - T_std (None, int, or float) – The standard deviation of experimental temperature, in Kelvin. Defaults
to
None.
Raises: TypeError– If inputted parameters of an unacceptable type.ValueError– If an unexpected keyword argument is trying to be inputted.ValueError– If an unexpected ‘calibration’, ‘clumps’, ‘iso_params’, or ‘ref_frame’ name is trying to be inputted.ValueError– If the length of inputted experimental isotope data and time arrays do not match.
Notes
If inputted
Tis array-like, then the average and standard deviation will be extracted and stored.If
clumps = 'CO47', then all calculations assume mass-dependent d17O.If
clumps = 'CO47', then inputted d18O data must be in permille relative to VPDB, not VSMOW.This class does allow users to change the reference frame in which D values are reported, however, this functionality should be used with caution. Transer functions between “Ghosh” and “CDES” reference frame will likely vary between sample sets, and will certainly vary between labs. For this reason, it is recommended that users upload data in the I-CDES reference frame and perform all calculations within this frame (assuming data were generated along with carbonate standards as described in Bernasoni et al., 2021).
For calculating D-T calibrations in reference frames other than those used in the original publications (i.e.,
CDES25forPH12,Ghosh25forSE15,CDES90forBea17, andI-CDESforAea21), the following transfer function parameters are used:Ghosh_to_CDES_slope = 1.0381
Ghosh_to_CDES_intercept = 0.0266
CDES_AFF = 0.092
GHosh_AFF = 0.081
(data inputted in
I-CDEScannot be converted to other reference frames since this should be the only reference frame used moving forward). If other transfer function parameters are required, then users should input D-T calibrations as custom lambda functions.See also
isotopylog.kDistribution- The class for extracting and visualizing rate data from a given
HeatingExperimentinstance.
Examples
Generating a bare-bones HeatingExperiment instance without fitting any actual data:
#import packages
import isotopylog as ipl
import numpy as np

#make arbitrary dex, T, and tex
dex = np.ones(4,4)
tex = np.arange(0,4)
T = 450 + 273.15 #get to K

#make instance
he = ipl.HeatingExperiment(dex, T, tex)
Generating a HeatingExperiment instance by extracting data from a csv file:
#setting a string with the file name
file = 'string_with_file_name.csv'

#make HeatingExperiment instance without culling data
he = ipl.HeatingExperiment.from_csv(file, culled = False)

#or, cull the data that are too close to equilibrium (see PH12)
he = ipl.HeatingExperiment.from_csv(file, culled = True, cull_sig = 1)
Forward modeling some rate data:
#assuming a kDistribution instance kd exists
he.forward_model(kd)
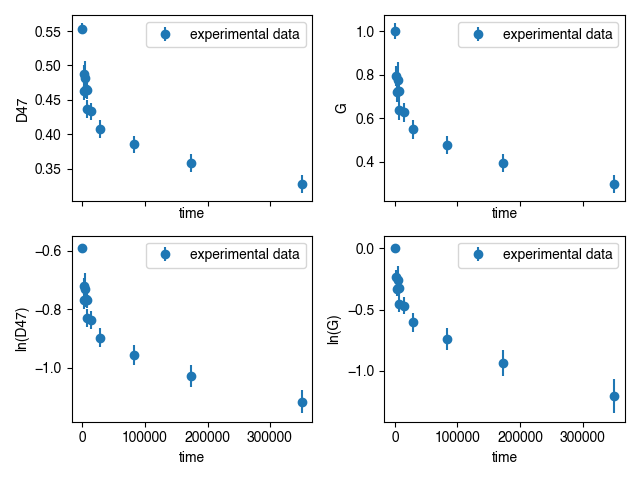
Plotting experimental and forward-modeled results:
#make an axis
fig, ax = plt.subplots(2,2,
        sharex = True)

#first, plot D
ax[0,0] = he.plot(ax = ax[0,0], yaxis = 'D', logy = False)

#second, plot G
ax[0,1] = he.plot(ax = ax[0,1], yaxis = 'G', logy = False)

#third, plot log(D)
ax[1,0] = he.plot(ax = ax[1,0], yaxis = 'D', logy = True)

#finally, plot log(G)
ax[1,1] = he.plot(ax = ax[1,1], yaxis = 'G', logy = True)
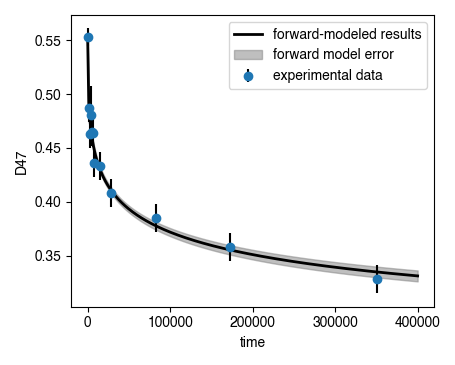
When making plots, one can pass various dictionaries containing stylistic keyword arguments:
fig, ax = plt.subplots(1,1)

#experimental data plt.errorbar dict
ed = {'fmt' : 'o', 'ecolor' : 'k'}

#forward-modeled mean plt.plot dict
ld = {'linewidth' : 2, 'c' : 'k'}

#forward-modeled uncertainty plt.fill_between dict
fbd = {'alpha' : 0.5, 'color' : [0.5, 0.5, 0.5]}

#plot the data
ax = he.plot(ax = ax, ed = ed, ld = ld, fbd = fbd)
Converting from CDES90 to CDES25 increases all data by
aff:he.change_ref_frame('CDES25', aff = 0.092)
Converting old data from Ghosh to CDES90:
he.change_ref_frame('CDES90',
        Ghosh_to_CDES_slope = 1.0381,
        Ghosh_to_CDES_int = 0.0266,
        aff = 0.092)
References
[1] Craig (1957) Geochim. Cosmochim. Ac., 12, 133–149.
[2] Li et al. (1988) Chin. Sci. Bull., 33, 1610–1613.
[3] Chang and Li (1990) Chin. Sci. Bull., 35, 290.
[4] Gonfiantini (1995) IAEA Technical Report, 825.
[5] Assonov and Brenninkmeijer (2003) Rapid Comm. Mass Spec., 17, 1017–1029.
[6] Barkan and Luz (2005) Rapid Comm. Mass Spec., 19, 3737–3742.
[7] Ghosh et al. (2006) Geochim. Cosmochim. Ac., 70, 1439–1456.
[8] Brand (2010) Pure Appl. Chem., 82, 1719–1733.
[9] Dennis et al. (2011) Geochim. Cosmochim. Ac., 75, 7117–7131.
[10] Passey and Henkes (2012) Earth Planet. Sci. Lett., 351, 223–236.
[11] Passey et al. (2014) Geochim. Cosmochim. Ac., 141, 1–25.
[12] Stolper and Eiler (2015) Am. J. Sci., 315, 363–411.
[13] Daëron et al. (2016) Chem. Geol., 442, 83–96.
[14] Bonifacie et al. (2017) Geochim. Cosmochim. Ac., 200, 255–279.
[15] Anderson et al. (2021) Geophys. Res. Lett., 48, e2020GL092069.
[16] Bernasconi et al. (2021) Geochem., Geophys., Geosys., 22, e2020GC009588.
-
__init__(dex, T, tex, **kwargs)¶ Initilizes the object.
Returns: he – The HeatingExperimentobject.Return type: isotopylog.HeatingExperiment
Methods
__init__(dex, T, tex, **kwargs)Initilizes the object. change_ref_frame(new_ref_frame[, …])Changes the HeatingExperiment reference frame and updates all clumped isotope data accordingly. forward_model(kd[, nt, z])Forward models a given kDistribution instance to produce predicted evolution. from_csv(file[, calibration, culled, cull_sig])Imports data from a csv file and creates a HeatingExperiment object from those data. plot([ax, yaxis, logy, plot_reg, ed, ld, …])Plots experimental and forward-modeled results in various user-defined ways. Attributes
DArray containing the forward-modeled clumped isotope data. D_stdArray containing the forward-modeled clumped isotope data uncertainty, as +/- 1 sigma. GArray containing the forward-modeled raction progress data. G_stdArray containing the forward-modeled reaction progress uncertainty, as +/- 1 sigma. GexArray containing the measured experimental reaction progress data. Gex_stdArray containing the measured experimental reaction progress uncertainty, as +/- 1 sigma. TThe experimental temperature, in Kelvin T_stdThe uncertainty on experimental temperature. caleqThe lambda equation used for calculating T-D relationships. calibrationThe T-D calibration equation to be used for modeling data. clumpsThe clumped isotope system associated with a given experiment. dexArray containing the measured experimental isotope data. dex_stdArray containing the measured experimental data uncertainty, as +/- 1 sigma. iso_paramsThe isotope parameters used for calculating clumped values. ref_frameThe reference frame being used for experimental isotope data. summaryDataFrame containing all the summary data. tArray of forward-modeled time, in same units as tex.- dex (array-like) – Array of experimental isotope values, written for each time point as
[D, d1, d2] where D is the clumped isotope measurement (e.g., D47) and
d1 and d2 are the corresponding major isotope values, listed from
lowest to highest amu (e.g., d13C, d18O). Length